Screenshots Page
This page will be graphics intense! Here, I will show you some of the neat things that I have found out with Xastir. Each picture will have a caption below it, explaining what you are looking at. Note that if you right-click on the icons, you may find meaningful explinations of what they represent.
Also note that any fat, magic-marker looking lines were hand drawn by me, and are not generated by Xastir. For example, the black circles, the red circles, and the purple lines. I use them as examples to clarify points below.
Finally, if you have disabled / restricted certain kinds of APRS information like I do, you may not see all of the icons represented.
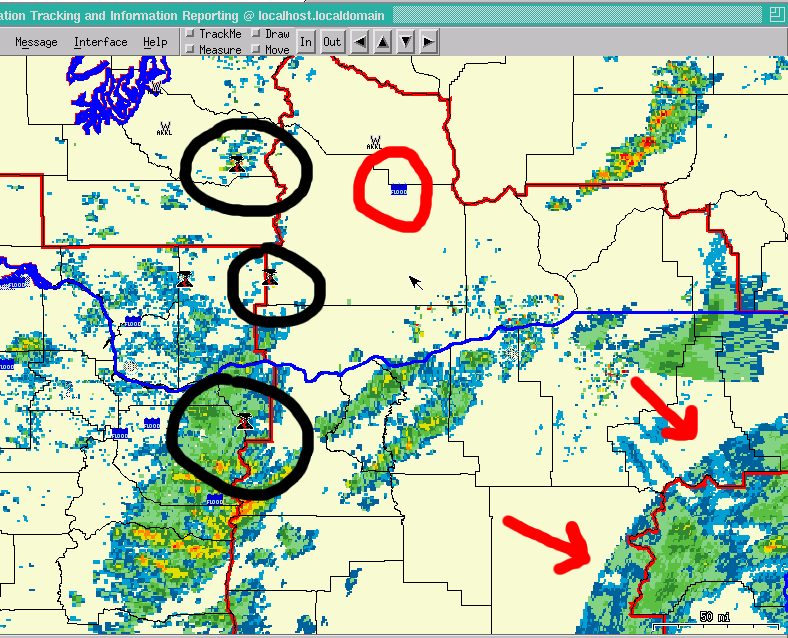
This is a shot from NW United States, near the Washington / Oregon boarder (blue line) and has a few WFO CWA's lined out (red lines). Note the black circles. There are volcano icons in there... may have been an eruption. Note Xastir does not clarify if it is major or not. Also look at the red circle. That is a flood warning. Also look at the red arrows... that radar arc is showing the range of one radar site "ending" and the other radars to the west not showing the adjacent precip. This is why you need to look closely at images to see/believe what the radar is really telling you.
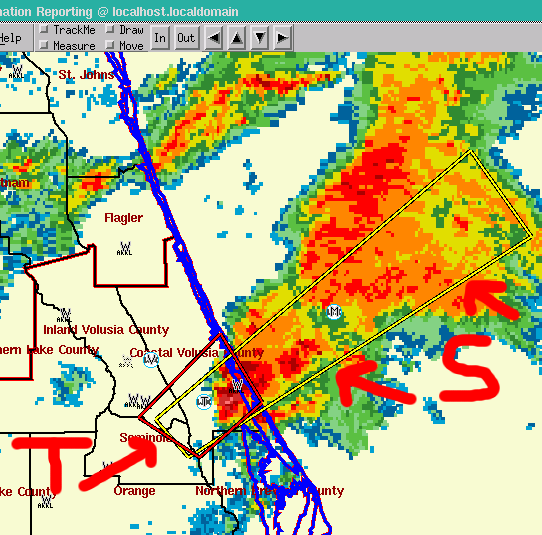
This is off the coast of Floridat. The red box is a Tornado Warning, and the yellow box is a Severe Thunderstorm warning. In this specific case, the warning is really a Special Marine Warning, but the criteria for each is quite close. Watches are shown with hatched red/yellow boxes.
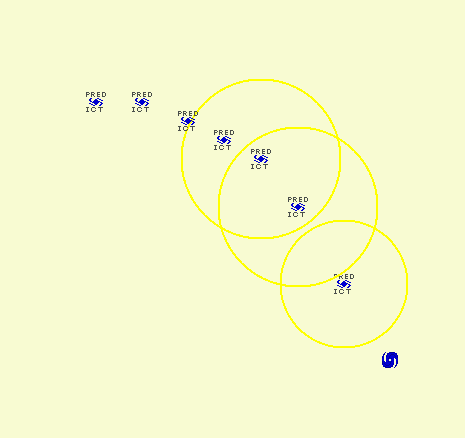
This is a hurricane, along with projected paths. Off the coast of Mexico, although I cropped out the outline of the country.
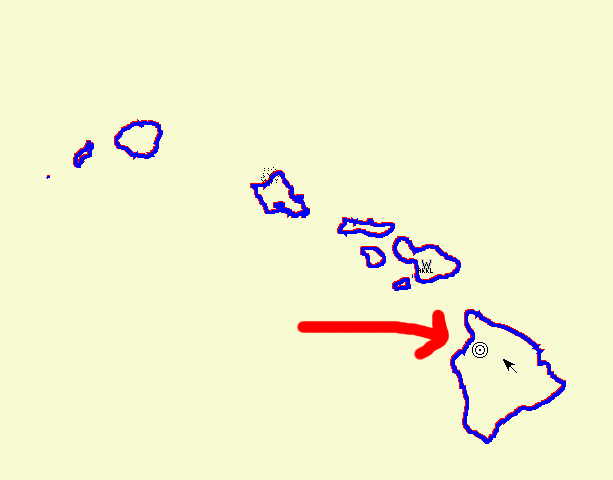
Hawaii. See the little "bulls-eye"? That is the marker for an earthquake.
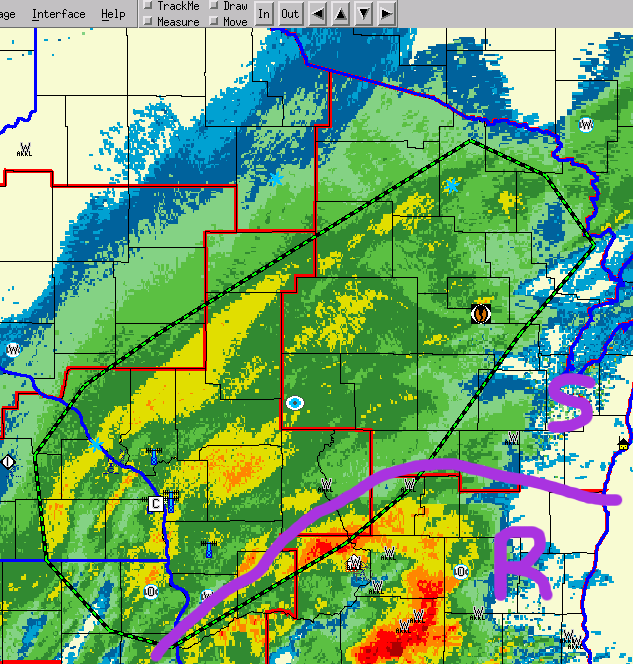
This image has a number of features. First, look at the green dashed circle. That is a MesoScale Discussion (MSD), issued by the Storm Prediction Center (SPC). These MSD's are often "pre-watches", meaning that the SPC is watching the area. In this case, they were concerned with heavy snowfall in central Wisconsin. Also, look at the purple line and writing. Areas on the "S" side are snow, and the "R" side are rain. How can you tell? Snow has a soft, radar-by-butterknife image, whereas rain is often more discrete with rain intensities.
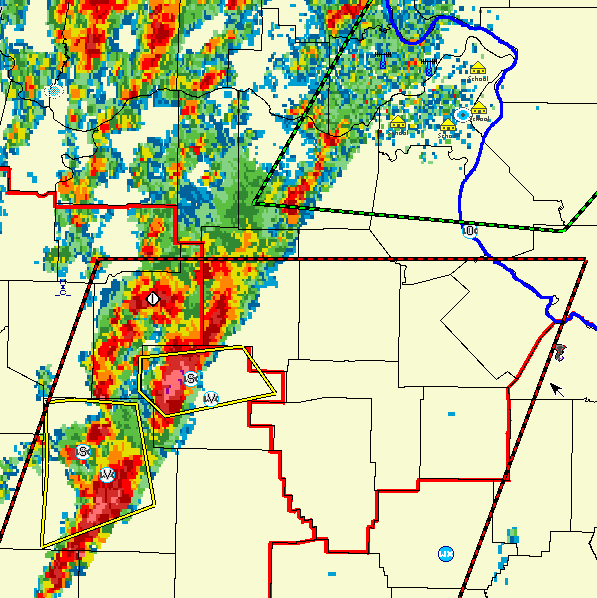
This image has a number of things going on. The green-dashed lines are part of a MesoScale Discussion. The dashed red box is a Tornado Watch. The solid yellow boxes are Severe Thunderstorm Warnings. The pink radar echos are returning large strong thunderstorms, probably containing large hail.
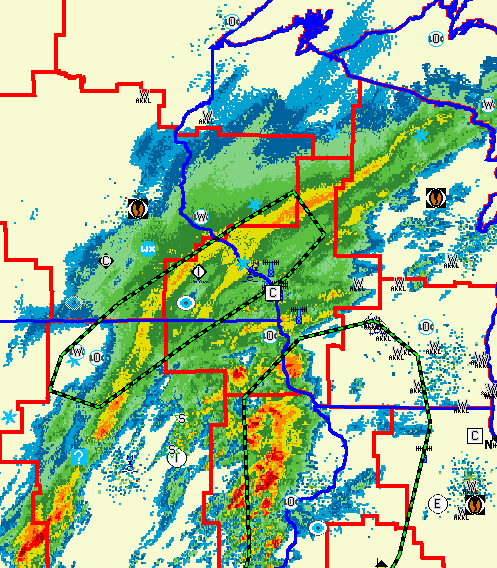
Zoomed out, we see rain and snow bands here. The snow is the soft echo returns that look smoothed out, like butter on toast. The rain / thunderstorms are the returns in the lower center that are more discrete and firm. There are two MesoScale Discussions active in this part of the country. The upper one is for heavy snow, and the lower one is for severe thunderstorm potential. Notice the little bulls-eye circle in each of them? Right click on the icons to see what the alert is all about.
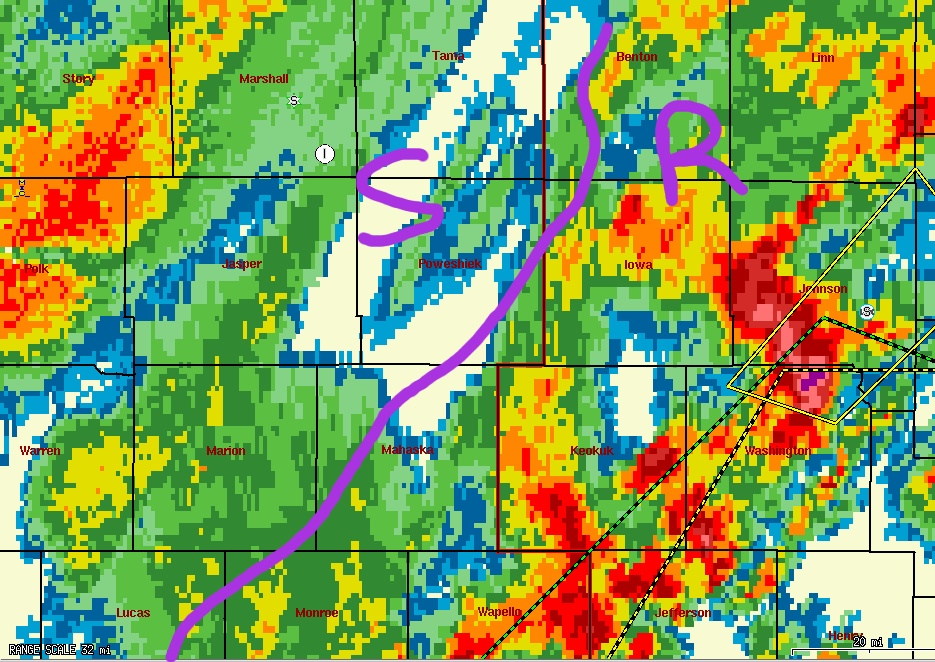
This image is a close-up in Iowa of the Rain / Snow event. Note the MSD, the Watches, and Warnings. Also note the purple line, which separates rain and snow.